 Domain SearchInstantly check and register your preferred domain name
 Web Hosting
 cPanel HostingHosting powered by cPanel (Most user friendly)
 WordPress HostingHost your WordPress website with fast, secure, and affordable WordPress hosting in Kenya.
 KE Domains
 Reseller HostingStart your own hosting business without tech hustles
 Windows HostingOptimized for Windows-based applications and sites.
 Free Domain
 Affiliate ProgramEarn commissions by referring customers to our platforms
 Free HostingTest our SSD Hosting for free, for life (1GB storage)
 Domain TransferMove your domain to us with zero downtime and full control
 All DomainsBrowse and register domain extensions from around the world
 .Com Domain
 WhoisLook up domain ownership, expiry dates, and registrar information
 VPS Hosting
 Managed VPSNon techy? Opt for fully managed VPS server
 Dedicated ServersEnjoy unmatched power and control with your own physical server.
 Website Builder
 Online Store BuilderLaunch a professional e-commerce store without writing code.
 Web Design ServiceGet a custom-designed website tailored to your brand and goals. From just KES 15,600
 BlogRead our guides on web hosting, online business, digital marketing, and more
 SupportOur support guides cover everything you need to know about our services
 ContactContact us via chat or email
One free monitoring tool can run on roughly 30-50 MB of RAM. Another wants 1-2GB for its server alone. Those figures come from a 2026 comparison of server monitoring tools. Yet both tools show up on the same “best open source” lists.
That gap is huge on a small budget. If your whole stack runs on a single modest VPS, the monitoring tool shouldn’t consume half of it.
Most top lists were written for teams that watch hundreds of machines. This guide targets a different reader. You run IT for a small business, often with no full-time sysadmin and no monitoring budget.
Below, you will find seven free tools, one pick for each situation, and the real costs of running them. Version details are current as of October 2026.
Best Free Server Monitoring Tools at a Glance
Short on time? Use this table to find your match, then read that tool’s section.
| Your situation | Best pick | Why |
|---|---|---|
| You only need to know if sites and services are up | Uptime Kuma | One container, tiny footprint, built-in status page |
| One to three servers, you want live CPU, RAM, and disk | Netdata | Per-second charts with almost no setup |
| Five to 20 servers on a tight RAM budget | Beszel | Small hub, light agents, simple dashboard |
| A growing mix of Windows and Linux servers | Zabbix | Free, no host limits, large template library |
| Many servers, and you want auto-discovery | Checkmk Raw | Finds hosts and services for you |
| You already wrote your own check scripts | Nagios Core | Plugin-based and highly flexible |
| You already run Docker or Kubernetes | Prometheus + Grafana | Built for containers and cloud-native apps |
Most small businesses end up running two tools. One watches uptime from the outside. The other watches CPU, RAM, and disk from the inside. For example, Uptime Kuma and Netdata together cover both jobs at a low cost.
What Small Businesses Need From Open Source Server Monitoring
A tool can look great on paper and still fail a small team. Check these five points before you install anything.
- Low footprint. The monitoring host shouldn’t need its own big server. RAM usage varies widely between tools.
- Short setup and low upkeep. Without a full-time admin, a tool should install in minutes, not days. Upgrades shouldn’t break your dashboards.
- Alerts where you read them. Look for email, Slack, Telegram, or SMS. A tool you never hear from won’t save you.
- Coverage for your operating systems. Many small offices run Windows servers. Check for a Windows agent or a remote check method.
- Clear licensing. Know what stays free and what sits behind a paid tier.
The Best Open Source Server Monitoring Tools for Small Businesses
Each tool below covers what it monitors, how much it costs to run, and where it falls short.
1) Uptime Kuma: Best for Simple Uptime Checks and Status Pages
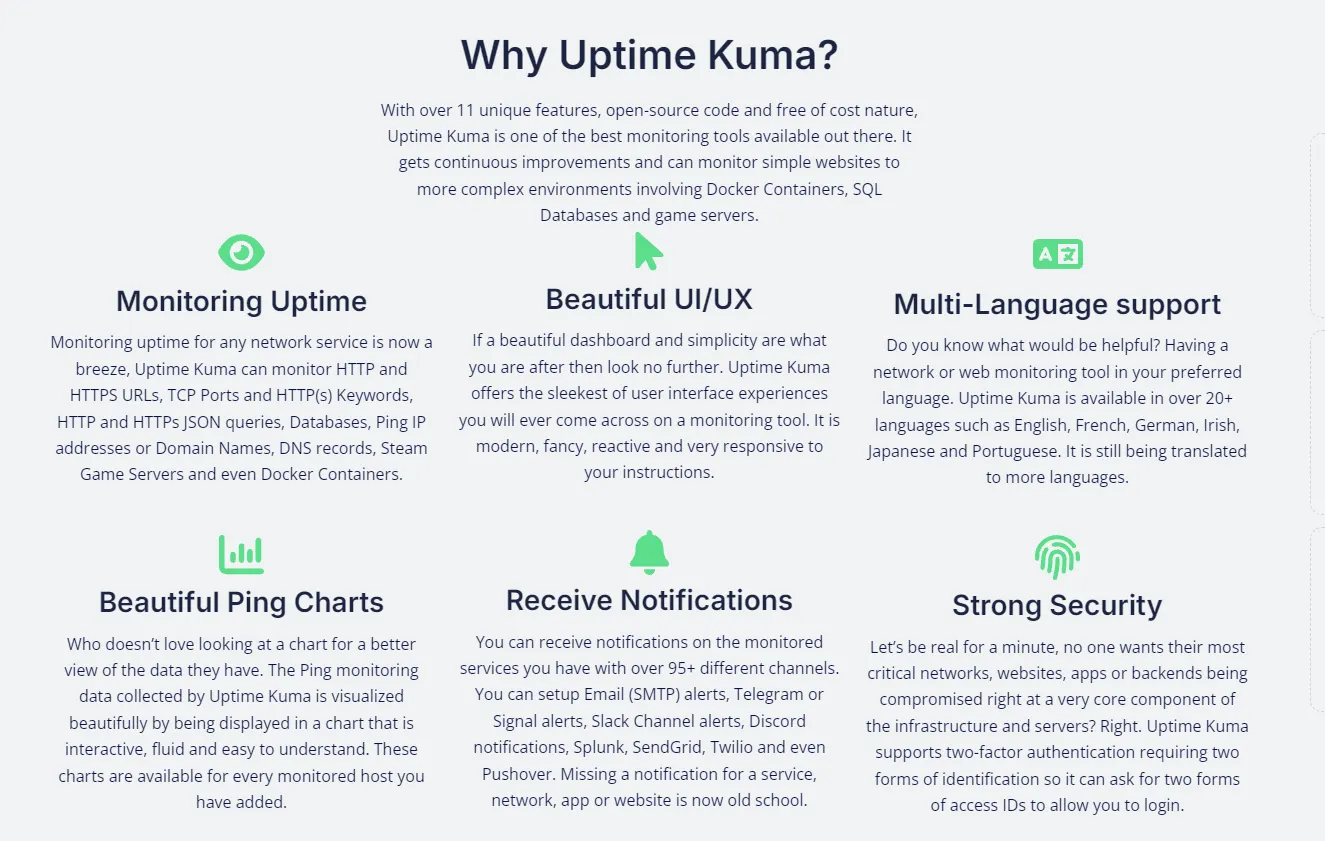
Uptime Kuma checks whether your websites, ports, and services respond. It doesn’t read CPU or RAM from inside your servers out of the box. So it answers “is it up?” and leaves “why is it slow?” to another tool.
- Footprint: It runs as a single container. One comparison puts it at about 30 to 50MB of RAM and a five-minute setup.
- Licence: MIT. There is no paid tier.
- Coverage: It offers 31 monitor types and 94 notification integrations, ensuring alerts reach almost any chat app.
- Limits: It uses a single shared login and has no official REST API for managing monitors. Status pages are basic.
- Watch out: If the host dies, monitoring stops. Run it away from the servers it watches.
For fewer than 200 endpoints, few tools beat it. Version 2.5.3 was current in August 2026.
2) Netdata: Best for Real-Time Health on a Few Servers
Netdata reads CPU, RAM, disk, and network every second. Install takes minutes, and the dashboards work with almost no tuning. When one server feels slow right now, this is the tool to open.
- License: The agent is open source. Viewing many servers in one place runs through Netdata Cloud, which has a paid tier.
- Version: 2.11.0 shipped in August 2026.
- Limits: Long-term history and central alert management are weaker than in Zabbix or Prometheus.
- Best fit: Finding out why a single server misbehaves, one machine at a time.
3) Beszel: Best Lightweight Hub for Small Fleets
Beszel uses a hub-and-agent design. One small hub collects metrics from an agent on each server. It tracks CPU, memory, disk, and network, and it shows Docker container stats.
One 2026 guide treats it as the light counterpart to Netdata. Its target audience is roughly 1-20 servers.
- Pick it when: RAM is tight, and you want a clean dashboard without much setup.
- Expect: Fewer checks and integrations than Zabbix.
- Watch out: This is a newer project, so the community is smaller than that of the older tools here.
4) Zabbix: Best All-in-One for Growing Small Businesses
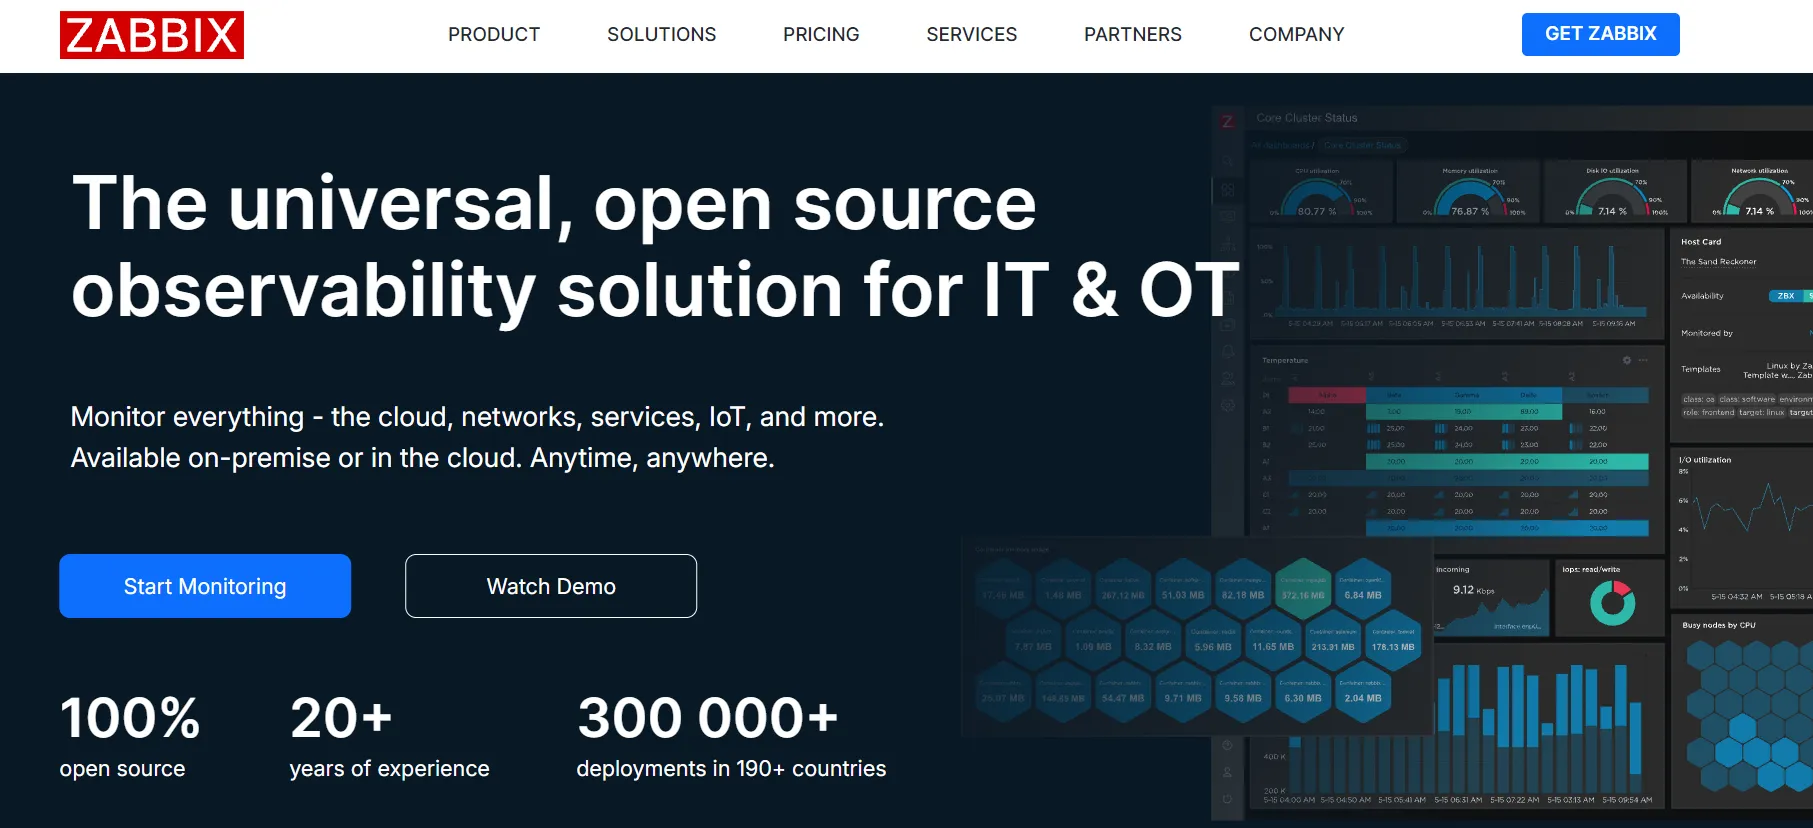
Zabbix covers servers, networks, applications, and websites in one system. It collects data through agents, polling, traps, SNMP, and templates. Few free tools match that range.
- License: AGPL-3.0. The vendor states the software has no license fee, device limit, or feature gate.
- Paid extras: Zabbix Cloud starts at $50 per month, but the self-hosted version is complete and free.
- Stack: You run a server, a database, and a web frontend. Expect a heavier footprint than Uptime Kuma, Netdata, or Beszel.
- Limits: The learning curve is steeper. Templates for common devices cut down the work.
It suits a business that will outgrow a handful of servers and wants one free system for all of them.
5) Checkmk Raw Edition: Best for Auto-Discovery on Mixed Fleets
Checkmk finds hosts and services on its own. That removes much of the manual setup you’d face with Nagios, which shares a heritage with.
- License: The Raw Edition is free under GPLv2. Paid editions add features, so check Checkmk’s site for current free-edition limits.
- Footprint: The server requires about 1-2GB of RAM. One comparison lists a setup time of 30 minutes or more.
- Coverage: It has agents for Windows and Linux, plus a large plugin catalog.
- Best fit: Twenty or more mixed servers where manual setup would drag.
6) Nagios Core: Best for Teams That Already Script Their Checks
Nagios has been around since 1999. That history includes a huge plugin library and many old tutorials.
Is Nagios Core still free? Yes. Nagios Core is the open source product, while Nagios XI is the commercial one built on top of it.
- How it works: Checks run through plugins, such as NRPE and SSH.
- Limits: The web interface looks dated, and configuration files get heavy. New admins often bounce off.
- Pick it when: You already write check scripts, or you inherited a Nagios setup. Otherwise, Checkmk or Zabbix does the same job with less manual work.
7) Prometheus + Grafana: Best If You Already Run Containers
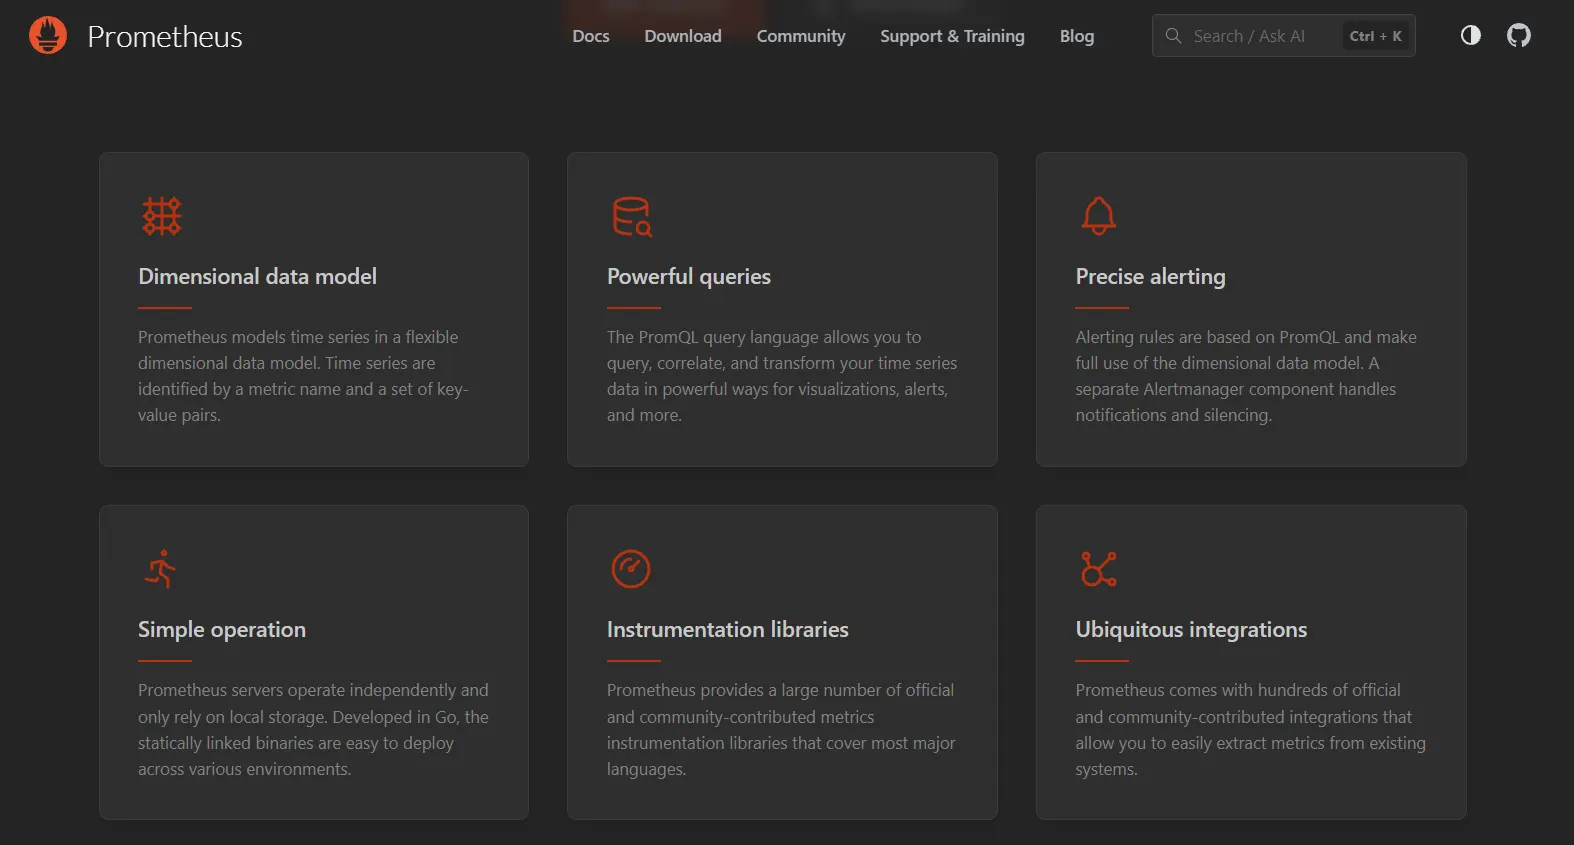
Prometheus pulls metrics from exporters on a schedule. Grafana draws the dashboards. Do you need Grafana? Prometheus has a basic built-in interface, yet most teams add Grafana for readable charts.
- License: Both are free. Prometheus is a CNCF project with no paid tier.
- Your job: You run storage, alert rules, and the uptime of the stack yourself.
- Limits: A 2026 comparison indicates that Zabbix or Checkmk better serves a mature estate of traditional servers.
- Best fit: A container-based stack with someone who’s comfortable writing queries.
Open Source Server Monitoring Tools Compared
How much RAM does a monitoring tool need? Plan for tens of megabytes at the light end and 1-2GB at the heavy end. Can these tools watch Windows servers? Yes. Most use an agent or an exporter, and Uptime Kuma checks from outside.
| Tool | RAM footprint | Licence | Paid tier | Setup time | Windows | Best for |
|---|---|---|---|---|---|---|
| Uptime Kuma | About 30 to 50MB | MIT | None | About 5 minutes | Remote checks only | Uptime and status pages |
| Netdata | Low to medium | Open source agent | Netdata Cloud | Minutes | Yes | Live server health |
| Beszel | Low | Open source | None | Minutes | Check the docs | Small fleets on tight RAM |
| Zabbix | Medium to high | AGPL-3.0 | Support and Cloud | Moderate | Yes, via agent | Growing mixed estates |
| Checkmk Raw | About 1 to 2GB (server) | GPLv2 | Paid editions | 30+ minutes | Yes, via agent | Auto-discovery on many hosts |
| Nagios Core | Low to medium | GPL | Nagios XI | Hours | Yes, via add-ons | Scripted checks |
| Prometheus + Grafana | Medium | Open source | Grafana Cloud | Hours | Yes, via exporter | Containers and cloud-native apps |
The RAM and setup figures for Uptime Kuma and Checkmk come from a 2026 comparison. The other cells are rough ratings. Test each tool on your own hardware before you commit.
If you want one free tool for a growing business, pick Zabbix. If you want the lightest setup, pair Uptime Kuma with Beszel or Netdata.
How to Choose the Right Free Server Monitoring Tool
Start with how many servers you run. Then match the tool to your team’s skills.
By server count
- One to three servers: Uptime Kuma for uptime, plus Netdata or Beszel for live health.
- Five to 20 servers: Beszel, if you want light and simple. Zabbix, if you want alert rules, templates, and history.
- More than 20 servers: Zabbix or Checkmk. Both handle growth without a license bill.
By team and setup
- Comfortable with Linux, new to monitoring: Uptime Kuma and Netdata are the gentlest places to start.
- Comfortable with config files and databases: Zabbix and Checkmk reward the extra effort.
- Windows-heavy office: Zabbix or Checkmk, using their Windows agents.
- Hosting client websites: Uptime Kuma for public status pages, plus Zabbix for server health.
Pairing tools is normal. One layer monitors uptime, another monitors resources, and a third may generate dashboards. That mix beats forcing one tool to do everything.
Sometimes, self-hosting loses. If no one on your team wants to patch a monitoring server, a hosted service may cost less than your team’s hours. Several hosted tools offer free plans that cover a handful of servers.
Is Open Source Monitoring Really Free? The Hidden Costs
The license is free. Your time and hosting are not. Here is where the real costs hide.
- Set up and upgrades. Budget a few hours for the first install. Then plan time for updates.
- Hosting. The monitoring tool needs a server. A small VPS is enough for the lighter tools.
- Monitoring the monitor. If your tool goes down, you get no alerts. Add one external uptime check on the monitoring host itself.
- Alert tuning. Too many alerts train people to ignore them. Start with three, and add more only when you act on the ones you have.
- Paid layers. Netdata Cloud, Checkmk’s commercial editions, and Zabbix all cost money. You can skip them, but know where the line sits.
So is it really free? Yes, if you count only the license. Count your hours, and the answer changes.
Your First Week With a Monitoring Tool
Install steps differ by tool, so follow each project’s official guide. This outline shows the order that works for most small teams.
- Day 1: Install your pick on a small VPS, away from the servers it will watch.
- Day 2: Add your most important server first.
- Day 3: Set three alerts: low disk space, high memory use, and a stopped service.
- Day 4: Send alerts to a channel someone reads every day.
- Day 5: Add an external uptime check for the monitoring host itself.
By Friday, you’ll have a working system. Add more servers once the first alerts prove useful.
FAQs
Is Zabbix better than Nagios?
For most small businesses, Zabbix is the easier pick. It ships with a web interface, templates, and built-in graphs. Nagios Core leans on configuration files and plugins. That gives you more control, but it takes more work. Choose Nagios only if you already run it or enjoy scripting checks.
What is the difference between Zabbix and Prometheus?
Zabbix watches traditional servers, network gear, and services through agents and SNMP. Prometheus pulls metrics from exporters and suits containers and cloud-native apps.
A 2026 comparison indicates that teams with both infrastructure and applications can run Zabbix or Checkmk alongside Prometheus. In that setup, Zabbix covers the hosts, and Prometheus covers the apps.
Pick One Tool and Run It This Week
You don’t need the perfect tool. You need a working one. Need uptime only? Install Uptime Kuma. Want live health on a few machines? Try Netdata or Beszel. Planning to grow? Start with Zabbix.
Monitoring only helps once it is running. Spin up a small VPS today and install your pick in an afternoon. A Truehost VPS gives your monitoring tool a home away from the servers it watches. View VPS plans.
Then follow the project’s official install guide, add your first server, and set your three alerts.