Domain SearchInstantly check and register your preferred domain name
 Web Hosting
 cPanel HostingHosting powered by cPanel (Most user friendly)
 KE Domains
 Reseller HostingStart your own hosting business without tech hustles
 Windows HostingOptimized for Windows-based applications and sites.
 Free Domain
 Affiliate ProgramEarn commissions by referring customers to our platforms
 Free HostingTest our SSD Hosting for free, for life (1GB storage)
 All DomainsBrowse and register domain extensions from around the world
 .Com Domain
 WhoisLook up domain ownership, expiry dates, and registrar information
 VPS Hosting
 Managed VPSNon techy? Opt for fully managed VPS server
 Dedicated ServersEnjoy unmatched power and control with your own physical server.
 SupportOur support guides cover everything you need to know about our services
Running a VPS without keeping an eye on its performance is a bit like driving without a dashboard, you might be fine for a while, but you won’t know there’s a problem until something stops working.
That’s why it’s crucial for you to learn how to monitor VPS if you have one.
Monitoring your VPS means tracking what’s happening under the hood: CPU usage, RAM consumption, disk I/O, and network bandwidth.
When you have visibility into these metrics, you can catch a memory leak before it brings your site down, spot unusual traffic spikes before they choke your server, and make smarter decisions about when, and if, to scale up your resources.
Now, if you have a business in Kenya, you know that every hour of downtime can translate to lost sales and frustrated customers, and so, that kind of awareness pays for itself quickly.
Good monitoring also keeps your costs in check. When you know exactly how your resources are being used, you stop guessing and start optimizing.
You only upgrade when you actually need to, not because something feels slow.
And of course, the tools in this guide work best when the server underneath them is solid.
At Truehost, our VPS plans, including the Kenya-optimized servers are built to give you a dependable foundation, with local data centers for faster speeds and managed options if you’d rather leave the heavy lifting to us.
With that said, here are the five tools you need to effectively monitor your VPS performance.
5 Tools You Need to Monitor VPS Performance
1) Netdata – Real-Time Performance Monitoring
Netdata is one of the easiest tools to start with when learning how to monitor VPS performance.
It’s a lightweight, real-time monitoring agent that pulls in thousands of metrics and displays them on clean, interactive web dashboards, all without putting any meaningful load on your server.
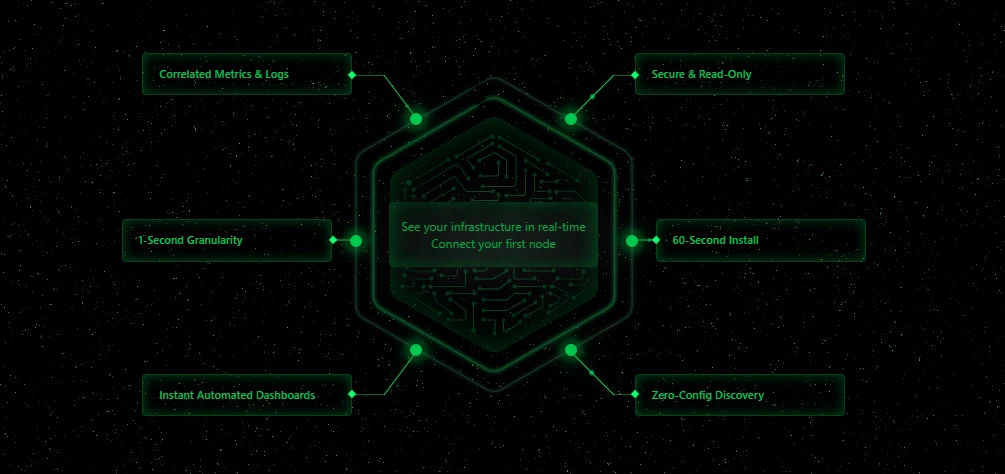
What makes it particularly useful for VPS monitoring is exactly that low footprint.
You get full visibility into CPU usage, network bandwidth, disk I/O, individual application processes, and much more, while the tool itself stays quietly out of the way.
The charts update live, so you’re always looking at what’s happening right now, not a snapshot from five minutes ago.
Getting it running takes almost no effort.
Netdata offers a single installation script directly from their website, run it, wait a few minutes, and your dashboard is ready. It works perfectly on Ubuntu and other Linux distributions common among Truehost users.
The dashboard is also beginner-friendly.
Instead of sorting through complicated logs, you get visual charts that help you quickly spot sudden spikes, overloaded resources, or unusual activity.
This makes troubleshooting much faster, especially during traffic surges or application issues.
Most of our customers who are just getting started with VPS monitoring reach for Netdata first, and for good reason.
It’s powerful enough to grow with you but approachable enough that you don’t need to be a sysadmin to get value from it on day one.
2) Htop – Interactive Process Viewer
If Netdata is your dashboard, Htop is your quick-look mirror.
It’s an upgraded take on the classic Unix top command, and it gives you a live, visual snapshot of everything your server is doing at any given moment, right inside your terminal.
One of the first things you notice in Htop is the color-coded CPU and memory bars displayed at the top of the screen.
These make it easy to check how heavily your server resources are being used at any moment.
Htop also allows you to sort processes, search for specific services, and stop problematic applications directly from the terminal. If a process suddenly starts consuming too much CPU or RAM, you can identify and end it in seconds without restarting the server.
Installing it on Ubuntu or Debian, the most common setups on Truehost VPS plans, takes only one command:
sudo apt update && sudo apt install htopThen just type htop to launch it.
It’s the kind of tool you’ll keep coming back to for everyday checks, especially when you’re already in the terminal and want answers without switching context.
3) Uptime Robot – External Uptime Monitoring
Most VPS monitoring tools focus on what is happening inside the server. Uptime Robot takes a different approach by checking your website or services from the outside.
This is useful because a server can appear healthy internally while visitors are still unable to access your website due to network problems, DNS issues, or complete outages.
Uptime Robot regularly checks your website, application, or server IP to confirm everything is online and accessible.
One of its biggest advantages is instant alerts. If your site goes down, you receive notifications through email, SMS, or other supported channels so you can respond quickly before customers start reporting issues.
The free plan is enough for many small websites and VPS users since it includes regular monitoring checks every five minutes.
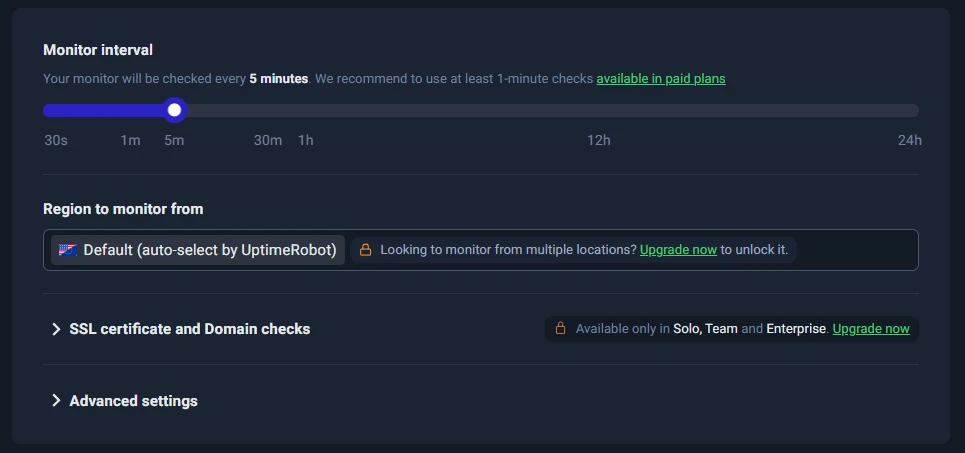
Paid plans offer faster monitoring intervals and additional features for businesses that need tighter uptime tracking.
Getting started is simple. Create an account on the official Uptime Robot website, add your domain name or server IP address, and configure the type of monitoring you want.
For VPS users running business websites on Truehost, Uptime Robot adds an extra layer of protection by helping you spot outages quickly and maintain reliable uptime for visitors.
4) Prometheus and Grafana – Advanced Historical Monitoring
Netdata and Htop are excellent for seeing what your server is doing right now.
But if you want to answer questions like:
- Why did performance dip last Tuesday?
- How has my CPU usage trended over the past three months?
That requires a different kind of tool.
Prometheus handles the data collection side. It records time-series metrics from your server continuously, building up a historical record you can query at any point.
Grafana then takes that data and turns it into dashboards you design yourself, like charts, graphs, and alerts tailor-made exactly to what your business needs to track.
Together, they’re the standard choice for teams that need more than a live snapshot.
You can spot usage trends before they become capacity problems, set up alerts based on patterns rather than just thresholds, and make long-term infrastructure decisions backed by actual data rather than guesswork.
The setup takes more effort than a one-line script, but the official Prometheus documentation walks you through deployment clearly.
Once it’s running, it scales alongside your infrastructure without complaint.
5) Glances – Lightweight Cross-Platform Overview
Htop is great for a quick terminal check, but it doesn’t show you everything at once.
Full web platforms like Netdata are powerful, but sometimes you just want something in between that is fast to launch, easy to read, and not heavy on resources.
That’s where Glances fits.
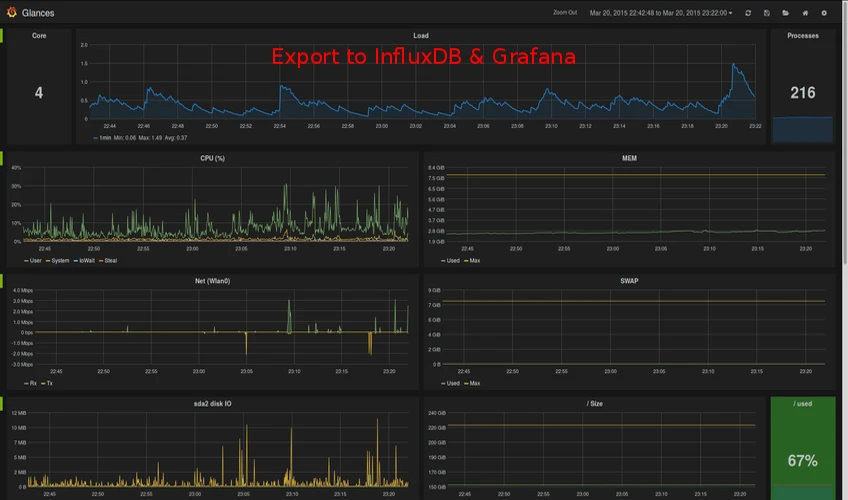
It gives you a detailed overview of CPU, memory, disk I/O, file system usage, and running processes all on one screen, with a color-coding system that makes problem-spotting immediate.
Green means you’re fine, yellow signals something worth watching, and red means act now.
It also offers a web interface if you’d rather view it through a browser than a terminal window.
Installing it is simple on any Python-based system:
pip install glancesThen run glances in your terminal to launch it, or add --webserver to pull it up in a browser.
So if you want quick, meaningful insights without committing to a heavier monitoring stack, Glances is a practical and reliable choice.
Best Practices for Effective VPS Monitoring
Having the right tools is only half the job. How you use them day to day makes just as much difference.
1. Start by combining real-time internal tools like Netdata or Glances, with external monitoring like Uptime Robot.
One tells you what’s happening inside the server, and the other confirms the outside world can still reach it. Running both means far fewer blind spots.
2. Set up alerts wherever possible so you’re not stuck manually checking dashboards.
Most of these tools can notify you before a problem becomes serious, and that early warning is often the difference between a five-minute fix and a full outage.
3. Make it a habit to review your resource trends monthly.
CPU and memory usage that creeps up gradually is easy to miss in daily checks but obvious when you look at a month’s worth of data. Catching that trend early means you can scale your plan on your terms, not under pressure.
4. On the security side, make sure your monitoring dashboards aren’t publicly exposed without authentication. Netdata and Grafana both offer access controls, so use them.
5. Finally, keep an eye on the monitoring tools themselves. They should be working quietly in the background, not competing with your applications for resources.
Get a Reliable VPS Hosting First
These tools can only do so much if the server underneath them isn’t solid. Monitoring a poorly performing VPS will tell you it’s struggling, but it won’t fix the foundation.
Pairing these tools with hosting from Truehost gives you a stronger foundation from the start.
Our Truehost VPS hosting includes features designed for performance and stability.
These features include local data centers for faster speeds within Kenya, SSD storage for quick read and write performance, and managed options if you’d prefer to have expert hands handling server-level tasks while you focus on your business.
Plus, when something does come up, our support team is available to help you work through it.
Now, if you want better control over your VPS performance, this is a good place to start.
The goal of monitoring is more than just watching your server but rather to catch problems early, understand your infrastructure, and make confident decisions about growth.
Pair these five tools with a VPS that can actually handle your workload, and you’ll spend far less time putting out fires.