Domain SearchInstantly check and register your preferred domain name
 Web Hosting
 cPanel HostingHosting powered by cPanel (Most user friendly)
 KE Domains
 Reseller HostingStart your own hosting business without tech hustles
 Windows HostingOptimized for Windows-based applications and sites.
 Free Domain
 Affiliate ProgramEarn commissions by referring customers to our platforms
 Free HostingTest our SSD Hosting for free, for life (1GB storage)
 All DomainsBrowse and register domain extensions from around the world
 .Com Domain
 WhoisLook up domain ownership, expiry dates, and registrar information
 VPS Hosting
 Managed VPSNon techy? Opt for fully managed VPS server
 Dedicated ServersEnjoy unmatched power and control with your own physical server.
 SupportOur support guides cover everything you need to know about our services
Struggling to make sense of Google Analytics 4 (GA4)?
You’re not alone. With its shift to event-based tracking and new terminology, GA4 can feel overwhelming. But don’t worry—this guide breaks down GA4 metrics into simple terms, so you can confidently analyze your website or app’s performance.
By the end of this post, you’ll understand:
- What metrics are and why they matter.
- Key GA4 metrics like Average Engagement Time, Users, and Conversions.
- How to access and view these metrics in GA4.
- Practical tips to use these metrics effectively.
Let’s dive in!
What is a Metric in Google Analytics?
In Google Analytics, a metric is a number that measures user behavior. Think of it as a scoreboard showing how people interact with your site or app. For example:
- Users: How many people visited?
- Sessions: How many visits occurred?
- Pageviews: How many pages were viewed?
Metrics answer quantitative questions like “How much?” or “How many?”. They work alongside dimensions (categories like “Country” or “Device Type”) to give context.
More on dimensions later, here is the promise:
11 Key GA4 Metrics You Should Track
GA4 introduces new metrics and redefines old ones. Here’s what you need to know, along with how to access each metric in GA4:
1) Active Users
This measures how many people actively engaged with your site or app (e.g., clicked a link or watched a video).
In GA4, whenever you see “users” listed, it refers to “active users”.
GA4 focuses on active users in most reports, unlike Universal Analytics (UA), which focuses on total users.
An active is a visitor who has engaged with your website or app in a meaningful way, such as by:
- Having an engaged session lasting 10+ seconds,
- Viewed atleast 2 pages, or
- Converted atleast once.
It’s the Active Users that really tell you about the size of your engaged audience. They’re the ones who are actually interacting with your site.
That’s why Users / Total Users is the default metric in Google Analytics 4.
How to find Users in GA4:
You can find user data in several reports. The most common place is the “User overview” report, accessible from the left-hand navigation menu under “Reports” -> “Acquire users” -> “User overview.”
You can also find user metrics in other reports, such as the “Traffic acquisition” report.
2) Average Engagement Time
Average Engagement Time in Google Analytics 4 (GA4) measures the average time users actively engage with a website or app, focusing only on active time when the site is in the foreground.
So, if 10 users spend 5 minutes each on your site, the average engagement time is 5 minutes.
This replaces “Average Session Duration” in Universal Analytics. It tracks how long users spend actively interacting with your content.
- Calculation: Total Engagement Time ÷ Number of Sessions.
- GA4 vs. UA: GA4 provides more accurate data by excluding background tab time and including automatic events like video plays and scrolls.
- Benchmarks: A good average is around 49 seconds, with 2–3 minutes for e-commerce sites and 1–2 minutes for blogs/news platforms.
- How to Improve: Focus on optimizing content, enhancing user experience, and incorporating interactive features.
How to Access the Report:
- Log in to your GA4 account.
- Click on “Engagement” in the left-hand menu.
- Select “Engagement Overview,” to view Average Engagement Time.
- You can also find it in reports like User Acquisition, Traffic Acquisition, and Pages and Screens.
This metric helps you evaluate content performance, improve user engagement, and boost conversion rates
3) Engagement Rate
The engagement rate in Google Analytics 4 (GA4) measures the percentage of sessions where users actively interact with your website.
This metric shows how engaged your audience is with your content, replacing the old bounce rate from Universal Analytics to give a more complete picture of user activity.
The bounce rate is still available though…
How to Calculate Engagement Rate
The formula for engagement rate is:
Engagement rate = (Engaged sessions / Total sessions) × 100
What Counts as an Engaged Session?
A session is considered engaged if it meets at least one of these conditions:
- The session lasts 10 seconds or longer.
- The session includes two or more pageviews.
- The session includes a key event (previously known as conversion events in GA4)..
How to access it from Google Analytics:
- Go to the Reports Section:
- In the left-hand menu, click on “Reports.”
- Access the Engagement Report:
- Under the “Lifecycle” section, click on “Engagement.” Here you can go to Overview or Pages and Screens from the Engagement dropdown menu.
- Customize the Report to Add Engagement Rate:
- Click the “Customize report” button (pencil icon on the top right) to modify the report.
- In the customization panel, click “Metrics.”
- Search for “Engagement Rate” and add it to your report.
- Click “Apply” to save the changes.
- If you want, you could also add other metrics such as Bounce Rate from here
- Click save to save changes to your report or a new report.
- View the Engagement Rate:
- The engagement rate will now be displayed in your customized Engagement report.
Pro Tip: A high engagement rate means your content resonates with visitors, so do something with it, then do something similar. Smart marketers replicate success.
4) Conversions (Key Events)
Conversions are the most important events.
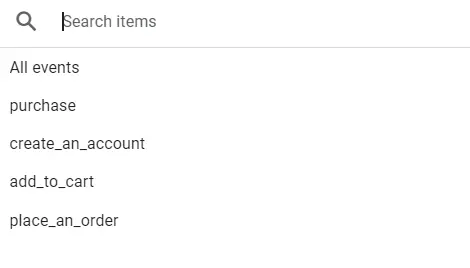
They’re the actions that align with your business goals. As a user, you need to first mark certain events as key events inside Google Analytics Dashboard.
Conversion events typically include:
- Making a purchase
- Downloading a resource
- Add-to-cart
- Placing an order
- Account creation, etc.
These events should be as close to sales as possible to help you make informed decisions on whether your marketing efforts are bringing you the right type of users.
How to find Conversions in GA4:
You can see your conversion data in the “Engagement” -> “Monetization” report. Like other events, conversions can also be added to other reports.
5) Sessions
In Google Analytics 4 (GA4), a session represents a time period during which a user actively interacts with your website or app.
- How it Starts: GA4 automatically triggers a session_start event when a user visits your website or opens your app, as long as there isn’t an active session already running. Each session is assigned a unique session ID (ga_session_id) and a session number (ga_session_number).
- Counting Sessions: GA4 counts sessions based on the session_start event. Each new visit generates a new session ID, increasing the session count for that user.
- Session Duration: By default, a session times out after 30 minutes of inactivity, but you can adjust this setting. The maximum timeout period is 7 hours and 55 minutes.
- GA4 vs. Universal Analytics (UA): In UA, a session was defined as a group of “hits” within a time frame. In GA4, it’s based on events, providing more flexibility and detailed insights. GA4 also tracks user activity automatically, which can result in higher active user counts compared to UA.
Where to Find Session Metrics in GA4
You can view session data in several GA4 reports:
- Acquisition Overview Report
- User Acquisition Report
- Traffic Acquisition Report
- Engagement Overview Report
- Demographic Details Report
- Tech Details Report
To find total sessions:
- Go to Reports in your GA4 account.
- Click on Acquisition, then select Traffic Acquisition.
- Click on the “Sessions” header to sort data by different channel groupings.
6) Event Count
In Google Analytics 4 (GA4), an event count tracks the number of times a specific user interaction occurs on your website or app.
It helps you measure how often users engage with different elements, such as:
- Clicking buttons
- Playing videos
- Submitting forms
- Downloading files
- Scrolling through pages
Why Event Count Matters
Event counts give you insights into user behavior and engagement.
By analyzing which events occur most frequently, you can:
- Identify popular content and features
- Understand user preferences
- Make data-driven decisions for website design, content strategy, and marketing
Types of Events in Ga4
- Enhanced Measurement Events: Automatically track interactions like scroll depth, outbound clicks, file downloads, and video views.
- Automatically Collected Events: Track events like ad clicks, pageviews, and first visits without extra setup.
- Custom Events: Events you create to track specific actions tailored to your business goals, like coupon usage or specific button clicks.
- Recommended Events: Suggested by Google for common scenarios, such as purchases, refunds, or adding items to a cart.
How Event Counts Work
To track an event, you’ll need to add event tracking code to the website elements you want to monitor.
When a user interacts with those elements, the code triggers an event, and GA4 records it.
You can view these events in the Events Report within GA4, which displays:
- Total event counts
- Event categories
- Event actions
- Labels and values to analyze user engagement more deeply
Understanding event counts helps you pinpoint what drives user interaction, making it easier to optimize your website for better performance.
7) Retention
The retention metric in Google Analytics 4 (GA4) helps you understand how well your website or app keeps users coming back over time.
Unlike one-time engagement metrics, retention shows the long-term value of your content and marketing efforts by tracking returning users.
What is Retention in GA4?
Retention refers to the percentage of users who return to your site after their first visit. This metric helps measure user loyalty and the effectiveness of your content in encouraging repeat visits.
Key Reports for Retention Analysis
- Retention Overview Report: Found under Lifecycle → Retention, this report shows how many users come back after their initial session. It highlights user activity over days, weeks, or months, helping you spot trends in user engagement.
- User Explorer Report: Offers detailed insights into individual user journeys, allowing you to analyze specific behaviors that contribute to user retention.
- Engagement Metrics: Metrics like average engagement time, engagement rate, and engaged sessions provide a clearer picture of how deeply users interact with your content over time.
How to Analyze Returning Users
- Segment Comparisons: GA4 allows you to compare new and returning users based on behavior, demographics, and traffic sources. This helps identify what content or campaigns drive user loyalty.
- Repeat Visitors Audience: You can create custom audiences to track users who visit your site multiple times. This is useful for targeted marketing and personalized campaigns.
- User Flow Report: Visualizes the common paths that returning users take, helping you identify content that keeps them engaged and areas where they might drop off.
Calculating Retention Rate
To measure retention, you can calculate the percentage of returning users with this formula:
Retention Rate = (Returning Users / Total Users) × 100
This helps you gauge the effectiveness of your strategies in maintaining user interest over time.
Why Retention Matters
- Improves Customer Lifetime Value: Returning users are more likely to convert, engage, and contribute to higher revenue.
- Reduces Acquisition Costs: It’s cheaper to retain existing users than acquire new ones.
- Identifies Content Strengths: Helps you understand what content resonates with your audience, guiding future content strategies.
Tracking retention in GA4 provides critical insights into user loyalty, enabling data-driven decisions to improve user experience and long-term growth.
8) Revenue
Revenue metrics are crucial for tracking the income generated through your website or app.
These metrics provide insights into different aspects of your business’s financial performance, helping you make data-driven decisions.
Key Revenue Metrics in GA4
Total Revenue
Total revenue represents the combined income from purchases, subscriptions, and ad revenue, minus any refunds. This metric offers a comprehensive view of your overall financial performance.
Formula:
Total Revenue = Purchase Revenue + Subscription Revenue + Ad Revenue − Refunds
Why it matters: It provides a high-level snapshot of your business’s financial health, helping you monitor growth trends.
a) Purchase Revenue
Purchase revenue tracks the income generated from e-commerce transactions and in-app purchases. It accounts for the total revenue from completed purchases, subtracting any refunds.
Formula:
b) Purchase Revenue = Sum of all purchased items’ prices − Refunds
Technically, this includes events like purchase, in_app_purchase, app_store_subscription_renew, and app_store_subscription_convert, minus refund events.
Why it matters: This metric helps you evaluate how well your products or services are performing in terms of actual sales.
c) Item Revenue
Item revenue measures the revenue generated from individual items sold. It’s calculated based on the price of each item multiplied by the quantity purchased.
Formula:
Item Revenue = Price of the Item × Quantity Purchased
Why it matters: It provides detailed insights at the product level, helping you identify top-performing items and optimize inventory or marketing strategies.
How These Metrics Compare
- Total Revenue is the broadest metric, covering all income streams.
- Purchase Revenue is a subset of total revenue, focusing solely on e-commerce and in-app purchases.
- Item Revenue is the most specific, zeroing in on revenue from individual products.
9) Scroll Depth
Scroll depth in GA4 helps you measure how far users scroll on a webpage, giving insights into content engagement.
It’s represented as a percentage of the page’s total height, with 100% meaning the user reached the very bottom of the page.
Default Scroll Depth Tracking in GA4
GA4 comes with Enhanced Measurement enabled by default, which tracks scroll depth automatically when a user reaches 90% of the page’s height.
This helps you identify if visitors are consuming most of your content without requiring additional setup.
- Trigger Point: 90% scroll depth
- Purpose: Quickly gauge deep engagement with long-form content
Customizing Scroll Depth Tracking with Google Tag Manager (GTM)
If you want to track other scroll percentages like 25%, 50%, or 75%, you’ll need to set this up using Google Tag Manager (GTM).
Steps to Set Up Custom Scroll Depth Tracking:
- Enable Scroll Variables in GTM:
- Go to Variables in GTM.
- Enable Scroll Depth Threshold and Scroll Direction.
- Create a Scroll Trigger:
- Click Triggers → New → Scroll Depth.
- Choose Vertical Scroll Depth.
- Set custom thresholds like 25%, 50%, 75%, and 100%.
- Configure an Event Tag:
- Go to Tags → New and create a GA4 Event Tag.
- Name the event (e.g., scroll_depth).
- Add custom parameters to capture scroll percentages.
- Publish the Changes:
After testing, publish the container to make tracking live.
Limitations of Default GA4 Scroll Tracking
- Tracks Only at 90%: By default, GA4 tracks just the 90% scroll depth.
- Limited Customization: You can’t add extra parameters like specific thresholds without GTM.
- No Pixel Tracking: GA4 tracks scroll depth as a percentage, not in pixel values.
Analyzing Scroll Depth Data in GA4
To dive deeper into scroll data:
- Go to GA4 → Explore → Explorations.
- Create a custom report.
- Add dimensions like Page Title, Event Name (scroll), and Scroll Depth Threshold.
- Analyze user behavior to identify content drop-off points.
Combining scroll depth with metrics like engagement rate or average time on page helps you understand content performance and improve user experience. This is critical for landing and sales pages.b
10) Pages per Session
This metric shows how many pages a user views during a single session.
How to Access:
- Go to Reports > Life Cycle > Engagement > Engagement Overview.
- Look for the Pages/Session metric in the summary cards.
Example: If users view 5 pages per session, they’re likely exploring your site deeply.
11) User Demographics
GA4 provides metrics like age, gender, and location to help you understand your audience better.
How to Access:
- Go to Reports > User > User Demographics.
- Explore metrics like Age, Gender, and Location.
Why it matters: Tailor your content and marketing strategies to match your audience’s profile.
How GA4 Differs From Universal Analytics
GA4’s event-based model changes how metrics are calculated. Here’s a quick comparison:
| Metric | Universal Analytics | GA4 |
|---|---|---|
| Session Tracking | Session-based (timeouts after 30 mins) | Event-based (no fixed timeout) |
| Bounce Rate | Measured single-page visits | Replaced by Engagement Rate |
| User Measurement | Total Users | Active Users + Total Users |
Key Takeaway: GA4 prioritizes user engagement over passive pageviews.
How to Use GA4 Metrics Effectively
a) Set Up Custom Metrics
GA4 lets you create metrics for specific interactions. For example, track how many users watch a tutorial video or download a PDF.
Steps:
- Go to Admin > Custom Definitions > Custom Metrics.
- Define the metric (e.g., “Video Views”).
b) Analyze Engagement Trends
Use the Exploration Report to visualize metrics like:
- Average Engagement Time per page.
- Engagement Rate by traffic source.
c) Track Conversions Strategically
Don’t just track sales — monitor micro-conversions like newsletter sign-ups or cart additions. These reveal where users drop off in their journey.
Tools to Master GA4 Metrics
- GA4 Exploration Reports: Build custom reports with drag-and-drop metrics and dimensions.
- Google Data Studio: Create dashboards to visualize trends over time.
- GA4 Documentation: Bookmark Google’s official guide for detailed definitions.
“GA4 is designed for a privacy-first world, giving you insights without relying on cookies.”
— Google Analytics Team
Final Thoughts
GA4 metrics are powerful, but only if you understand what they mean. Start by focusing on Active Users, Engagement Rate, and Conversions—these reveal whether your content drives meaningful results.
Ready to explore GA4? Log in to your account, open the Exploration tab, and experiment with these metrics. The more you practice, the clearer your data story becomes.